Energy
EN3-7
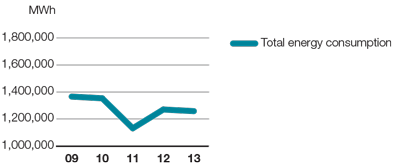
Energy consumption and efficiency improvements
In total, 90% (90) of the Group’s energy consumption derives from production facilities; the remaining 10% (10) comes from office and warehouses. Manufacturing comprises a mix of assembly and other processes such as metalworking, molding of plastics, painting and enameling.
EN3: Direct energy consumption by primary energy source [GJ]
| Year | Non-renewable primary source | Renewable primary source | |||||
|---|---|---|---|---|---|---|---|
|
|
Oil | Coal | Natural gas | LPG | Biofuel | Ethanol | Hydrogen |
| 2013 | 41,044 | 0 | 1,747,215 | 157,780 | 0 | 0 | 0 |
| 2012 | 33,228 | 0 | 1,757,249 | 209,864 | 0 | 0 | 0 |
| 2011 | 36,912 | 0 | 1,665,230 | 137,496 | 0 | 0 | 0 |
| 2010 | 51,269 | 0 | 2,040,902 | 142,856 | 0 | 0 | 0 |
| 2009 | 44,889 | 0 | 2,076,175 | 146,282 | 0 | 0 | 0 |
Note: The calculation was based on WRI’s “Calculation tool for direct emissions from stationary combustion calculation worksheet, v.3.”
EN4: Indirect energy consumption by primary source [GJ]
| Year | District heating | District cooling | Steam | Electricity | Renewables |
|---|---|---|---|---|---|
| 2013 | 53,880 | 7,513 | 2,773 | 2,518,925 | 0 |
| 2012 | 58,115 | 8,064 | 2,201 | 2,541,095 | 0 |
| 2011 | 77,206 | 8,204 | 2,535 | 2,239,373 | 2,904 |
| 2010 | 137,534 | 9,443 | 2,417 | 2,458,073 | 0 |
| 2009 | 115,364 | 7,632 | 1,937 | 2,542,494 | 0 |
Energy reduction performance was calculated according to World Resources Institute (WRI). Electricity emissions factors were updated according to the 2012 data set as published by the International Energy Agency (IEA).
Energy saved due to conservation
The Group has a strong track record in energy reduction in operations and has a 2015 target in place to reduce energy use by 15% compared to 2011 production volumes. This is incorporated into the Electrolux 2020 50% reduction target. The Group realized a 10% relative improvement in 2013 in comparable factories. In absolute terms, the result was an increase in energy use of 11% due to acquisitions and the start-up of new factories. The average energy consumption per unit produced in comparable factories has decreased by 21% over the last five years.
This data derives from 57 (58) factories, 43 (32) warehouses and 43 (48) offices.
EN5: Energy saved due to conservation and efficiency improvements [%]
| Year [GJ] |
Oil | Natural gas | LPG | District heating | District cooling | Steam | Electricity | Total |
|---|---|---|---|---|---|---|---|---|
| 2013 | 91% | 84% | 108% | 47% | 98% | 143% | 99% | 92% |
| 2012 | 74% | 85% | 143% | 50% | 106% | 114% | 100% | 93% |
| 2011 | 82% | 80% | 94% | 67% | 108% | 131% | 88% | 84% |
| 2010 | 114% | 98% | 98% | 119% | 124% | 125% | 97% | 98% |
| 2009 | 100% | 100% | 100% | 100% | 100% | 100% | 100% | 100% |
Green and gold at São Carlos
Continual improvement and teamwork are two hallmarks of Green Spirit, an internal program to improve efficiency. Achieving an absolute energy reduction of 6% – 9% on a per unit basis is a feather in the cap for São Carlos factory in Brazil and testament to the Green Spirit initiative.
CEO Statement
In 2013 we continued to deliver above our growth target and delivered 4.5% in organic sales growth.
CEO Statement
I'm convinced that raising product efficiency for the growing middle class is where long-term shareholder value creation lies.
Our products
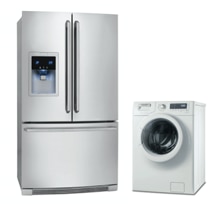
Electrolux is the only appliance manufacturer in the industry to offer complete solutions for both consumers and professionals. The focus is on innovative and energy-efficient products in the premium segments.
Sustainability
Achieving the Group's vision of sustainability leadership is crucial to realizing the business strategy. The objective is to develop smarter, more accessible, resource-efficient solutions that meet people's needs and improve their lives. Read the comprehensive sustainability performance review.
Awards & recognition
Financial Reporting
Net sales for the Electrolux Group in 2013 amounted to SEK 109,151m, as against SEK 109,994m in the previous year. The organic sales growth was 4.5%, while currencies had an impact of -5.3%.
