Emissions, effluents and waste
EN16-25
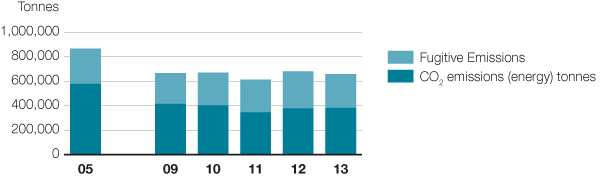
Greenhouse gas emissions reductions achieved
Energy efficiency measures implemented at Electrolux through the Green Spirit program have saved almost 200,000 tonnes of CO2 equivalent between 2005 and 2013.
These efficiency measures resulted in lower annual energy costs of approximately SEK 300m per year.
Elimination of high global warming potential greenhouse gases resulted in the avoidance of approximately 28,000 tonnes CO2e in 2013
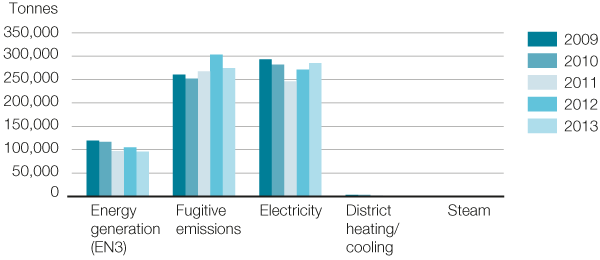
EN16: Greenhouse gas emissions in tonnes
EN 18: Total greenhouse gas emissions
EN 18: Greenhouse gas emission reductions achieved (%)
| CO2 emission compared to 2005 | Electrolux Group |
|---|---|
| 2013 | 66% |
| 2012 | 65% |
| 2011 | 60% |
| 2010 | 70% |
| 2009 | 72% |
|
|
|
| 2005 | 100% |
EN 19: Emissions of ozone depleting substances [kg, CFC-11 eq.]
|
|
Production | Refrigerant | Foam | Total [kg CFC eq] |
|---|---|---|---|---|
| 2013 | 107 | 61 | 230 | 398 |
| 2012 | 373 | 73 | 493 | 938 |
| 2011 | 157 | 330 | 0 | 488 |
| 2010 | 295 | 330 | 2,618 | 3,243 |
| 2009 | 131 | 141 | 3,711 | 3,982 |
Fresh footprint
In China, food scraps comprise 70% of all waste nationwide and $32 billion worth of food is thrown away every year. Enter the Electrolux NutriFresh refrigerator, designed with moveable glass bins, humidity control, and dual deodorizers to keep food fresher longer.
Waste water discharge
The indicator 'Quality of water' is not reported on due to incomplete data.
EN 21: Total water discharge by quality and destination [m3 / year]
| Year | Municipal | Other recipients | ||
|---|---|---|---|---|
|
|
Untreated | Pre-treated | Untreated | Pre-treated |
| 2013 | 1,638,043 | 388,048 | 1,247,808 | 1,389,240 |
| 2012 | 1,358,546 | 372,521 | 1,579,703 | 1,211,067 |
| 2011 | 1,683,867 | 202,923 | 1,586,936 | 1,226,498 |
| 2010 | 2,436,453 | 715,502 | 2,072,647 | 1,254,977 |
| 2009 | 3,066,198 | 958,009 | 2,342,995 | 1,238,348 |
| 2008 | 3,314,549 | 1,463,470 | 2,366,308 | 1,373,503 |
Weight of waste and disposal method
The reporting organization and waste disposal contractors defined the method of disposal.
EN 22: Total weight of waste by type and disposal method [tonnes]
| År | Hazardous waste | Non-hazardous waste | ||||
|---|---|---|---|---|---|---|
|
|
|
Composting | Recycling | Incineration | Landfill | Deep well injection |
| 2013 | 3,693 | 188 | 141,581 | 483 | 14,231 | 0 |
| 2012 | 3,309 | 1,205 | 194,098 | 1,268 | 13,612 | 0 |
| 2011 | 2,197 | 1,503 | 138,919 | 749 | 12,642 | 0 |
| 2010 | 2,912 | 735 | 146,711 | 984 | 18,065 | 0 |
| 2009 | 4,116 | 507 | 150,397 | 2,013 | 18,682 | 435 |
Volume of significant spill
The number of incidents has been investigated. No significant spills have been identified, as reported in the Board of Director's report.
StopSearchHereCEO Statement
In 2013 we continued to deliver above our growth target and delivered 4.5% in organic sales growth.
CEO Statement
I'm convinced that raising product efficiency for the growing middle class is where long-term shareholder value creation lies.
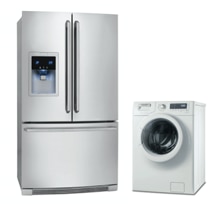
Our products
Electrolux is the only appliance manufacturer in the industry to offer complete solutions for both consumers and professionals. The focus is on innovative and energy-efficient products in the premium segments.
Sustainability
Achieving the Group's vision of sustainability leadership is crucial to realizing the business strategy. The objective is to develop smarter, more accessible, resource-efficient solutions that meet people's needs and improve their lives. Read the comprehensive sustainability performance review.
Awards & recognition
Financial Reporting
Net sales for the Electrolux Group in 2013 amounted to SEK 109,151m, as against SEK 109,994m in the previous year. The organic sales growth was 4.5%, while currencies had an impact of -5.3%.
