Parent Company cash flow statement
| SEKm | 2012 | 2013 |
|---|---|---|
| Operations |
|
|
| Income after financial items | 948 | -1,861 |
| Depreciation and amortization | 220 | 279 |
| Capital gain/loss included in operating income | 2 | 915 |
| Share-based compensation | -157 | 22 |
| Group contributions | 164 | 164 |
| Taxes paid | -424 | 77 |
| Cash flow from operations, excluding change in operating assets and liabilities | 753 | -404 |
| Change in operating assets and liabilities |
|
|
| Change in inventories | -10 | -2,129 |
| Change in trade receivables | -55 | -203 |
| Change in current intra-group balances | -1,368 | 1,573 |
| Change in other current assets | 77 | -523 |
| Change in other current liabilities and provisions | 199 | 1,610 |
| Cash flow from operating assets and liabilities | -1,157 | 328 |
| Cash flow from operations | -404 | -76 |
| Investments |
|
|
| Change in shares and participations | -185 | -306 |
| Capital expenditure in intangible assets | -266 | -378 |
| Capital expenditure in property, plant and equipment | -54 | -146 |
| Other | 207 | 815 |
| Cash flow from investments | -298 | -15 |
| Total cash flow from operations and investments | -702 | -91 |
| Financing |
|
|
| Change in short-term investments | 90 | - |
| Change in short-term borrowings | -368 | 222 |
| Change in intra-group borrowings | 2,693 | 1,399 |
| New long-term borrowings | 2,802 | 2,997 |
| Amortization of long-term borrowings | -3,087 | -1,858 |
| Dividend | -1,860 | -1,860 |
| Sale of shares | 212 | - |
| Cash flow from financing | 482 | 900 |
| Total cash flow | -220 | 809 |
| Liquid funds at beginning of year | 2,206 | 1,986 |
| Liquid funds at year-end | 1,986 | 2,795 |
CEO Statement
In 2013 we continued to deliver above our growth target and delivered 4.5% in organic sales growth.
CEO Statement
I'm convinced that raising product efficiency for the growing middle class is where long-term shareholder value creation lies.
Our products
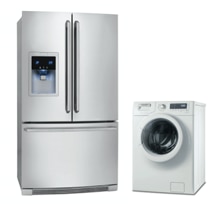
Electrolux is the only appliance manufacturer in the industry to offer complete solutions for both consumers and professionals. The focus is on innovative and energy-efficient products in the premium segments.
Sustainability
Achieving the Group's vision of sustainability leadership is crucial to realizing the business strategy. The objective is to develop smarter, more accessible, resource-efficient solutions that meet people's needs and improve their lives. Read the comprehensive sustainability performance review.
Awards & recognition
Financial Reporting
Net sales for the Electrolux Group in 2013 amounted to SEK 109,151m, as against SEK 109,994m in the previous year. The organic sales growth was 4.5%, while currencies had an impact of -5.3%.
