Financial position
- Equity/assets ratio was 20.8% (23.2).
- Return on equity was 4.4% (14.4).
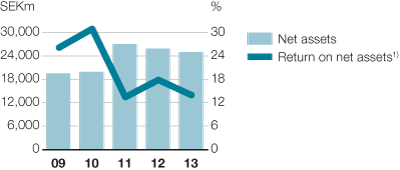
- Return on net assets, excluding items affecting comparability, decreased to 14.0% (17.9).
- Financial net debt increased to SEK -7,673m (-5,685).
Net assets and working capital
Working capital amounted to SEK -5,800m (-6,505), corresponding to -5.1% (-5.7) of net sales.
Net assets and working capital
| SEKm | Dec. 31, 2012 | % of annualized net sales |
Dec. 31, 2013 | % of annualized net sales |
|---|---|---|---|---|
| Inventories | 12,963 | 11.3 | 12,154 | 10.6 |
| Trade receivables | 18,288 | 15.9 | 19,441 | 17.0 |
| Accounts payable | -20,590 | -17.9 | -20,607 | -18.0 |
| Provisions | -6,697 |
|
-7,556 |
|
| Prepaid and accrued income and expenses | -7,467 |
|
-7,933 |
|
| Taxes and other assets and liabilities | -3,002 |
|
-1,299 |
|
| Working capital | -6,505 | -5.7 | -5,800 | -5.1 |
| Property, plant and equipment | 16,693 |
|
17,264 |
|
| Goodwill | 5,541 |
|
4,875 |
|
| Other non-current assets | 8,003 |
|
5,263 |
|
| Deferred tax assets and liabilities | 2,158 |
|
3,359 |
|
| Net assets | 25,890 | 22.5 | 24,961 | 21.8 |
| Average net assets | 27,070 | 24.6 | 27,148 | 24.9 |
| Return on net assets, % | 14.8 |
|
5.8 |
|
| Return on net assets, excluding items affecting comparability, % |
17.9 |
|
14.0 |
|
Adjusted for items affecting comparability, i.e., restructuring provisions, average net assets increased to SEK 28,915m (28,112), corresponding to 26.5% (25.6) of net sales.
Net assets
Change in net assets
| SEKm | Net assets |
|---|---|
| December 31, 2013 | 25,890 |
| Change in restructuring provisions | -843 |
| Write-down of assets | -1,967 |
| Changes in exchange rates | -1,467 |
| Capital expenditure | 3,535 |
| Depreciation | -3,356 |
| Other changes in fixed assets and working capital, etc. | 2,964 |
| December 31, 2013 | 24,961 |
Liquid funds
Liquidity profile
| SEKm | Dec. 31, 2012 | Dec. 31, 2013 |
|---|---|---|
| Liquid funds | 7,403 | 7,232 |
| % of annualized net sales1) | 13.1 | 13.2 |
| Net liquidity | 4,320 | 4,262 |
| Fixed interest term, days | 16 | 12 |
| Effective annual yield, % | 2.1 | 1.6 |
Liquid funds as of December 31, 2013, amounted to SEK 7,232m (7,403), excluding short-term back-up credit facilities. Electrolux has two unused committed back-up facilities. One EUR 500m multi-currency revolving credit facility, approximately SEK 4,400m, maturing in 2018 and a credit facility of SEK 3,400m, maturing in 2017.
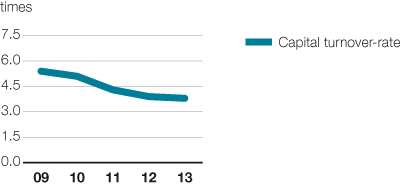
Capital turnover-rate
Net debt
Net debt
| SEKm | Dec. 31, 2012 | Dec. 31, 2013 |
|---|---|---|
| Borrowings | 13,088 | 14,905 |
| Liquid funds | 7,403 | 7,232 |
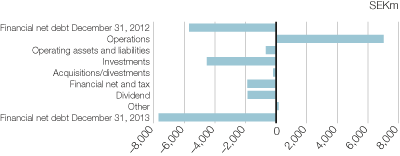
| Financial net debt | 5,685 | 7,673 |
| Net provisions for post-employment benefits | 4,479 | 2,980 |
| Net debt | 10,164 | 10,653 |
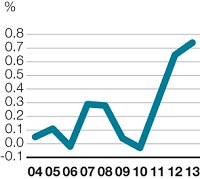
| Net debt/equity ratio | 0.65 | 0.74 |
| Equity | 15,726 | 14,308 |
| Equity per share, SEK | 54.96 | 49.99 |
| Return on equity, % | 14.4 | 4.4 |
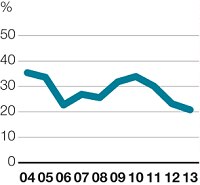
| Equity/assets ratio, % | 23.2 | 20.8 |
The financial net debt increased by SEK 1,988m as a result of the negative cash flow from operations and investments as well as the dividend payment. Net provision for post-employment benefits declined by SEK 1,499m.
During 2013, SEK 1,851m in long-term borrowings were amortized and new long-term borrowings were raised with SEK 3,039m.
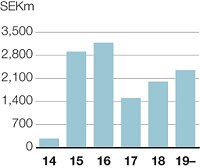
Long-term borrowings as of December 31, 2013, including long-term borrowings with maturities within 12 months, amounted to SEK 12,207m with average maturity of 3.3 years, compared to SEK 11,005m and 3.1 years at the end of 2012. During 2014 and 2015, long-term borrowings in the amount of SEK 3,067m will mature.
The Group’s goal for long-term borrowings includes an average time to maturity of at least two years, an even spread of maturities, and an average interest-fixing period between one and three years. At year-end, the average interest-fixing period for long-term borrowings was 1.0 year (1.4).
At year-end, the average interest rate for the Group’s total interest-bearing borrowings was 3.2% (3.9).
Cash flow and change in financial net debt
Long-term borrowings, by maturity
Rating
Electrolux has investment-grade ratings from Standard & Poor’s. In 2013, the outlook for the rating was changed to negative.
Rating
|
|
Long-term debt | Outlook | Short-term debt | Short-term debt, Nordic |
|---|---|---|---|---|
| Standard & Poor’s | BBB+ | Negative | A-2 | K-1 |
Net debt/equity and equity/assets ratio
The net debt/equity ratio was 0.74 (0.65). The equity/assets ratio decreased to 20.8% (23.2).
Net debt/equity ratio1) |
Equity/assets ratio1) |
|---|---|
|
|
Equity and return on equity
Total equity as of December 31, 2013, amounted to SEK 14,308m (15,726), which corresponds to SEK 49.99 (54.96) per share. Return on equity was 4.4% (14.4).
StopSearchHereCEO Statement

In 2013 we continued to deliver above our growth target and delivered 4.5% in organic sales growth.
CEO Statement
I'm convinced that raising product efficiency for the growing middle class is where long-term shareholder value creation lies.
Our products
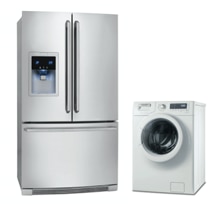
Electrolux is the only appliance manufacturer in the industry to offer complete solutions for both consumers and professionals. The focus is on innovative and energy-efficient products in the premium segments.
Sustainability
Achieving the Group's vision of sustainability leadership is crucial to realizing the business strategy. The objective is to develop smarter, more accessible, resource-efficient solutions that meet people's needs and improve their lives. Read the comprehensive sustainability performance review.
Awards & recognition
Financial Reporting
Net sales for the Electrolux Group in 2013 amounted to SEK 109,151m, as against SEK 109,994m in the previous year. The organic sales growth was 4.5%, while currencies had an impact of -5.3%.
