Operations by business area
- Sales growth in all business areas except for Major Appliances Europe, Middle East and Africa.
- Continued sales growth in emerging markets.
- Operating income for Major Appliances North America improved significantly.
- Weak markets, lower volumes and price pressure impacted results for Major Appliances Europe, Middle East and Africa.
- Average number of employees increased to 60,754 (59,478).
The Group’s operations include products for consumers as well as professional users. Products for consumers comprise major appliances, i.e., refrigerators, freezers, cookers, dryers, washing machines, dishwashers, room air-conditioners and microwave ovens, floor-care products and small domestic appliances. Professional products comprise food-service equipment for hotels, restaurants and institutions, as well as laundry equipment for apartment-house laundry rooms, launderettes, hotels and other professional users.
In 2013, major appliances accounted for 87% (87) of net sales, professional products for 5% (5) and small appliances for 8% (8).
Major business events during 2013
November 28. Launch of premium appliances range in China
Electrolux has launched a full range of kitchen and laundry appliances exclusively designed for the Chinese market. It is the Group’s largest product launch this year and is a key initiative for growth in this important market. The new range covers more than 60 products and includes refrigerators, washing machines, cooking hobs, hoods and dish sterilizers.
Share of sales by business area
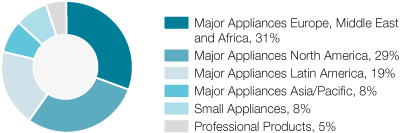
Major Appliances Europe, Middle East and Africa
Europe declined in 2013 by 1% year-over-year. Demand in Western Europe declined by 1%. Demand decreased in for Electrolux important markets such as France, Italy and the Benelux countries, while Germany saw some growth. Demand in Eastern Europe increased slightly. Demand in Russia slowed down in the latter part of the year.
Organic sales in Europe was unchanged year-over-year. The product mix improved, but this was offset by lower sales volumes and price pressure. The extensive launch of new products under the Electrolux Inspiration Range, which started in 2012, continued during the year and has been launched across all markets in Europe. This has improved the product mix. In the fourth quarter, the Group regained market shares in several regions under own strategic brands.
Operating income declined versus last year. Lower sales volumes in several of Electrolux core markets, unfavorable currency movements and price pressure were the main factors.
During the fourth quarter of 2013, actions were initiated to reduce overhead costs and to improve the competitiveness within manufacturing, see page 96.
Key figures
| SEKm | 2012 | 2013 |
|---|---|---|
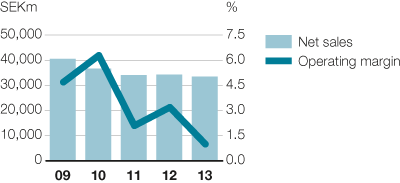
| Net sales | 34,278 | 33,436 |
| Organic growth, % | -0.9 | -0.2 |
| Operating income | 1,105 | 347 |
| Operating margin, % | 3.2 | 1.0 |
| Net assets | 8,733 | 8,528 |
| Return on net assets, % | 12.2 | 3.8 |
| Capital expenditure | 1,011 | 1,294 |
| Average number of employees | 24,479 | 23,629 |
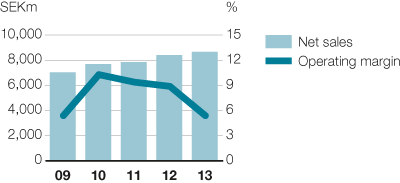
Net sales and operating margin
Major Appliances North America
Market demand in North America for core appliances increased by 9% in 2013 compared with 2012. Market demand for major appliances including microwave ovens and home-comfort products, such as room air-conditioners increased by 5% in 2013 year-over year.
Organic sales in North America increased by 7.6% year-over-year, due to higher volumes of core appliances. The favorable market environment, launches of new products and new distribution channels had a positive impact on sales. Electrolux sales volumes rose in several of the core appliance product categories and the Group captured market shares in these categories.
Operating income improved substantially due to volume growth and price/mix improvements.
The consolidation of production of cooking products to Memphis, Tennessee, USA, from L’Assomption, Quebec, Canada continued throughout 2013. This had a negative impact on earnings, due to higher manufacturing costs for operating two factories simultaneously.
In 2013, agreements were settled with participants in pension plans to receive a lump-sum payment for accrued pension rights and thereby leave the plan. This resulted in an accounting gain of SEK 133m, which is included in the operating income for the business area, see page 102.
Key figures
| SEKm | 2012 | 2013 |
|---|---|---|
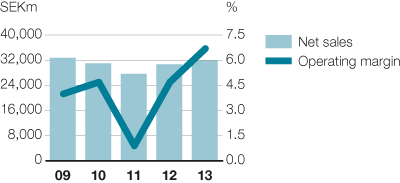
| Net sales | 30,684 | 31,864 |
| Organic growth, % | 6.9 | 7.6 |
| Operating income | 1,452 | 2,136 |
| Operating margin, % | 4.7 | 6.7 |
| Net assets | 4,813 | 5,280 |
| Return on net assets, % | 33.4 | 40.9 |
| Capital expenditure | 1,771 | 855 |
| Average number of employees | 11,319 | 12,597 |
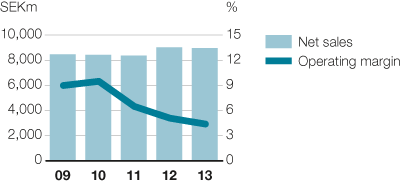
Net sales and operating margin
Major Appliances Latin America
Market demand for core appliances in Latin America is estimated to have increased in 2013 year-over-year, while demand in Electrolux largest market Brazil declined. The market demand in 2012 in Brazil was partly driven by the government’s incentive program for appliances.
The organic sales growth in Latin America was mainly driven by price increases and an improved customer mix. The fire in September 2013 at Electrolux warehouse for refrigerators and freezers in Curitiba, Brazil, impacted sales volumes negatively in the latter part of the year.
Operating income declined. During the year, the Brazilian real and other Latin American currencies weakened versus the US dollar. Negative currency movements affected the overall profit significantly. Higher prices contributed to earnings, while higher costs for sourced products had a negative impact.
Key figures
| SEKm | 2012 | 2013 |
|---|---|---|
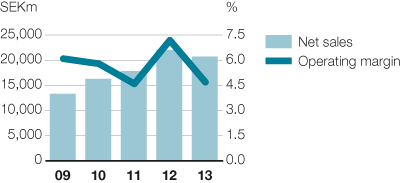
| Net sales | 22,044 | 20,695 |
| Organic growth, % | 20.6 | 6.1 |
| Operating income | 1,590 | 979 |
| Operating margin, % | 7.2 | 4.7 |
| Net assets | 6,736 | 6,554 |
| Return on net assets, % | 22.1 | 13.8 |
| Capital expenditure | 488 | 742 |
| Average number of employees | 13,812 | 14,239 |
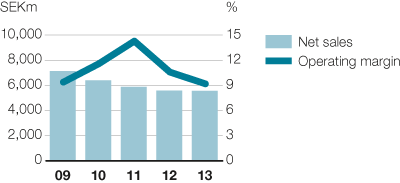
Net sales and operating margin
Major Appliances Asia/Pacific
Market demand for major appliances in Southeast Asia, and China continued to show strong growth in 2013. Market demand in Australia also increased.
Electrolux organic sales growth was strong due to higher volumes and price increases. Sales volumes increased in all regions.
Operating income declined. Negative currency development impacted results as the US dollar strengthened against the Australian dollar and several other currencies in emerging markets.
In 2013, Electrolux launched a new range of products for the Chinese market. The launch was the Group’s largest in 2013 and it will continue in 2014. More than 60 new products for kitchen and laundry were introduced in the important growth market China. The cost for these launch activities had an adverse impact on earnings.
In addition, start-up costs for the new factory for refrigerators and freezers in Rayong in Thailand impacted operating income negatively, while higher sales volumes and increased prices contributed to operating income.
Key figures
| SEKm | 2012 | 2013 |
|---|---|---|
| Net sales | 8,405 | 8,653 |
| Organic growth, % | 2.9 | 10.8 |
| Operating income | 746 | 467 |
| Operating margin, % | 8.9 | 5.4 |
| Net assets | 2,225 | 2,014 |
| Return on net assets, % | 33.3 | 21.0 |
| Capital expenditure | 411 | 267 |
| Average number of employees | 3,313 | 3,719 |
Net sales and operating margin
Small Appliances
Market demand for vacuum cleaners in Europe declined somewhat in 2013, while demand in North America increased compared with the previous year.
The organic sales growth was due to an improved product mix, higher volumes and higher prices. Sales volumes of small domestic appliances and handheld vacuum cleaners were strong and increased in most regions, particularly in Asia/Pacific and Europe. The significance of sales related to small domestic appliances is increasing.
Operating income for 2013 declined compared to the previous year. Increased costs for sourced products in Europe and Brazil, related to the strengthening of the US dollar against local currencies impacted earnings negatively. 2013 was an intensive launch year, with new products introduced in several markets. This improved the product mix. Mix improvements and higher prices made a positive contribution to results.
Key figures
| SEKm | 2012 | 2013 |
|---|---|---|
| Net sales | 9,011 | 8,952 |
| Organic growth, % | 6.0 | 4.4 |
| Operating income | 461 | 391 |
| Operating margin, % | 5.1 | 4.4 |
| Net assets | 1,555 | 1,554 |
| Return on net assets, % | 23.9 | 22.1 |
| Capital expenditure | 196 | 225 |
| Average number of employees | 2,737 | 2,683 |
Net sales and operating margin
Professional Products
In 2013, market demand in Southern and Northern Europe, where Electrolux holds a strong position, remained weak and declined year-over-year, while demand in emerging markets and in the US increased somewhat.
The organic sales growth was due to an improved product mix. This is a result of the Group’s strategic initiatives to grow in new markets and segments. Sales were particularly strong in emerging markets and in the US.
Operating income declined compared to last year. This is mainly a result of a weaker performance in the first half of the year, with lower sales volumes following a soft market. Investments in new products to promote growth in new markets and channels also impacted results negatively in 2013, while price increases and mix improvements made a positive contribution.
The market introduction of the ultra-luxury product range, Electrolux Grand Cuisine, continued throughout the year.
Key figures
| SEKm | 2012 | 2013 |
|---|---|---|
| Net sales | 5,571 | 5,550 |
| Organic growth, % | -3.9 | 1.7 |
| Operating income | 588 | 510 |
| Operating margin, % | 10.6 | 9.2 |
| Net assets | 983 | 960 |
| Return on net assets, % | 61.7 | 54.1 |
| Capital expenditure | 161 | 76 |
| Average number of employees | 2,581 | 2,595 |
Net sales and operating margin
CEO Statement

In 2013 we continued to deliver above our growth target and delivered 4.5% in organic sales growth.
CEO Statement
I'm convinced that raising product efficiency for the growing middle class is where long-term shareholder value creation lies.
Our products
Electrolux is the only appliance manufacturer in the industry to offer complete solutions for both consumers and professionals. The focus is on innovative and energy-efficient products in the premium segments.
Sustainability
Achieving the Group's vision of sustainability leadership is crucial to realizing the business strategy. The objective is to develop smarter, more accessible, resource-efficient solutions that meet people's needs and improve their lives. Read the comprehensive sustainability performance review.
Awards & recognition
Financial Reporting
Net sales for the Electrolux Group in 2013 amounted to SEK 109,151m, as against SEK 109,994m in the previous year. The organic sales growth was 4.5%, while currencies had an impact of -5.3%.
