The Electrolux share is listed on Nasdaq OMX Stockholm. The market capitalization of Electrolux at year-end 2011 was approximately SEK 34 billion (60), which corresponded to 1.0% (1.4) of the total value of Nasdaq OMX Stockholm. The company’s shares outstanding are divided into A-shares and B-shares.
Dividend
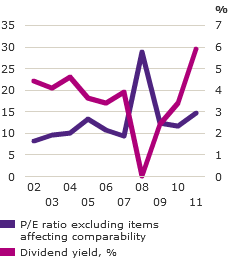
The Board of Directors proposes a dividend for 2011 of SEK 6.50 per share, equivalent to a total dividend payment of approximately SEK 1,850m. The proposed dividend corresponds to approximately 86% of income for the period, excluding items affecting comparability. Based on the share price at the end of 2011, the dividend yield for 2011 amounted to 5.9%.
The Group’s goal is for the dividend to correspond to at least 30% of income for the period, excluding items affecting comparability. For a number of years, the dividend level has been considerably higher than 30%.
Performance of the Electrolux share
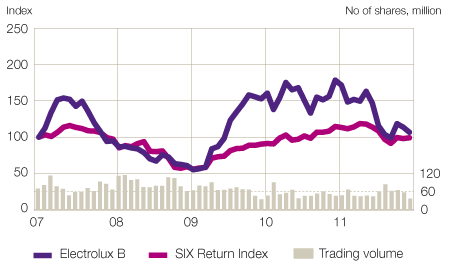
Following very strong income and share-price performance in 2009 and 2010, the market had very high expectations of Electrolux in early 2011. Strong price pressure, higher raw-material costs and weak demand from the Group’s major markets resulted in a decline in the Group’s profitability in 2011. Factors behind the fall in the Electrolux share price during the year included the weaker income trend combined with poor overall performance of the Swedish stock exchange.
Total return of Electrolux B-shares and trading volume
on Nasdaq OMX Stockholm, 2007–2011

Yield
The opening price for the Electrolux B-share in 2011 was SEK 191.00. The highest closing price was SEK 195.60 on January 3. The lowest closing price was SEK 95.30 on September 12. The closing price for the B-share at year-end 2011 was SEK 109.70, which was 43% lower than at year-end 2010. Total return during the year was –39%.
Over the past ten years, the average total return on an investment in Electrolux shares has been 8.5%. The corresponding figure for SIX Return Index was 6.0%.
Share volatility
Over the past three years, the Electrolux share has shown a volatility of 48% (daily values), compared with an average volatility of 29% for Nasdaq OMX Stockholm. The beta value of the Electrolux share over the past five years is 1.12*. A beta value of more than 1 indicates that the share’s sensitivity to market fluctuations is above average.
*) Compared to Nasdaq OMX STO.
Conversion of shares
In accordance with the Articles of Association of AB Electrolux, owners of
Incentive programs
Electrolux maintains a number of long-term incentive programs for senior management. Since 2004, the Group has three-years performance-based share programs.
No B-shares were allotted under the 2008 performance-based share program. At year-end 2011, the incentive programs corresponded to a maximum dilution of 1.59% of the total number of shares, or 4,598,651
Trading volume
Lately, there has been a clear trend towards new trading venues for shares. During 2011, 46% of Electrolux B-shares were traded outside Nasdaq OMX Stockholm, compared with 41% during 2010. In 2011, the Electrolux share accounted for 2.5% (3.0) of the shares traded on Nasdaq OMX Stockholm, of a total trading volume of SEK 3,684 billion (3,627).
Ownership structure
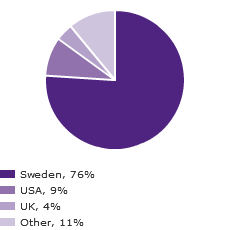
The majority of the total share capital as of December 31, 2011, was owned by Swedish institutions and mutual funds (approximately 66%). At year-end, approximately 10% of the shares were owned by Swedish private investors.
During 2011, the proportion held by foreign owners decreased slightly and amounted to approximately 24% at the end of the year. The volume of shares traded by foreign owners has a significant effect on share liquidity. Foreign investors are not always recorded in the share register. Foreign banks and other custodians may be registered for one or several customers’ shares, and the actual owners are then usually not displayed in the register.
DJSI World Index
The Group’s sustainability performance and strategy help attract and strengthen relations with investors. In 2011 and for the fifth consecutive year, Electrolux was recognized as a leader in the consumer durables industry sector in the prestigious Dow Jones Sustainability Index (DJSI). Electrolux thereby ranks among the top 10% of the world’s 2,500 largest companies for social and environmental performance. With 60 DJSI licenses in 16 countries, assets managers with DJSI portfolios valued at USD 8 billion are recommended to invest in Electrolux.


