
Electrolux will continue to reduce its environmental footprint by shifting to renewables and optimizing use of energy and other resources across operations.
| The roadmap to 2020 | Next steps | |
|---|---|---|
| Improve energy efficiency of manufacturing sites and warehouses by 20% by 2020 (baseline 2015), engaging all facilities worldwide. |
Continue to drive energy efficiency in operations through our Green Spirit certification process. Replace inefficient equipment with more efficient models. Improve and optimize use of existing manufacturing equipment. |
|
| Reduce water consumption in manufacturing by 5% every year in areas of water stress, until the site has reached optimal levels of efficiency. |
Continue to drive water management and replace inefficient equipment and processes with more efficient models. |
|
| Attain energy-management certification for our operations across the world. |
Attain global certification for energy management according to ISO50001 by 2018. |
|
| Increase our use of renewable energy. |
13 manufacturing sites in Sweden, Hungary, Poland, Romania, Italy and Germany will only procure electricity from renewable sources as of 2016. |
|
On track
Additional effort is required
Off track
Work has not yet begun
Through ambitious targets and by integrating our goals into the Group’s manufacturing system, we’ve demonstrated real progress in reducing our CO2 footprint in operations.
Year on year, we have shown that ambitious targets coupled with integrating our thinking into manufacturing processes lessens our CO2 impact considerably. Average energy consumption per unit produced has decreased by 18% over the last five years, exceeding our 2015 target by three percentage points. The benefits don’t stop there: had we maintained the same energy consumption levels as in 2005, Electrolux would have had to pay SEK 400m per year more in energy costs.
This year, our efforts have focused on investment and further integration into operations and along our supply chain. We have:
The energy management system ISO50001 has been implemented in two sites to date and several are in the process of certification.
As our performance improves, it is becoming increasingly challenging to realize new savings with optimal pay-back times. We are ready to raise our level of ambition in the use renewables; hydro, solar, wind and biomass alternatives. We will also apply the lessons learned from existing onsite renewable installations and explore new projects around the world.
Energy and water management in operations is coordinated and best practice is shared among manufacturing sites through our Green Spirit program. We have both relative and absolute targets for energy consumption. Action plans include energy management, technological investments and employee awareness raising and behavioral change. Each facility reports energy and water consumption data monthly, and this data is aggregated on a regional and global level. Performance indicators for the Group are followed up on a monthly basis.
All Electrolux sites are evaluated annually against criteria that include energy performance and -management as well as implemented actions and are thereafter rated on a scale of zero to three. Criteria for achieving Green Spirit certification are raised every year.
| 2011 | 2012 | 2013 | 2014 | 2015 | |
| <strong>Energy per standard unit</strong> | 100 | 92 | 89 | 89 | 82 |
| Energy consumption | 100 | 112 | 111 | 107 | 104 |
| Waste generation (excluding recycling) | 100 | 113 | 108 | 98 | 76 |
| Water consumption | 100 | 110 | 94 | 86 | 80 |
| 2005 | 2011 | 2012 | 2013 | 2014 | 2015 | ||
| Greenhouse gas (GHG) emissions intensity | 8.55687943 | 6.030283917 | 6.187626272 | 6.012940538 | 5.519636174 | 5.14647547 |
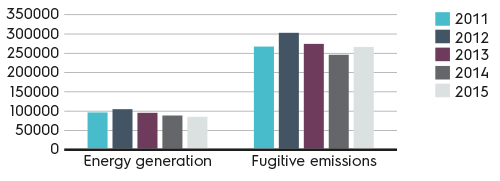
1) Fugitive emissions included. These are derived from use of HFC gases for cooling in facilities, refrigerants in products and as foaming gases.
Since 2005, our performance has resulted in a decoupling of revenue growth from CO2 emissions. We have achieved a savings of 225,000 tonnes of CO2 equivalent in operations between 2005 and 2015, while the Group’s revenue has increased by 23%.