Dividend
The Board of Directors proposes a dividend for 2010 of SEK 6.50 per share, equivalent to a total dividend payment of approximately
SEK 1,850m. The proposed dividend corresponds to approximately 40% of income for the period, excluding items affecting
comparability.
The Group’s goal is for the dividend to correspond to at least 30% of income for the period, excluding items affecting comparability. For a number of years, the dividend level has been considerably higher than 30%.
Development of the Electrolux share
Following very strong income and share-price development in 2009, the market had very high expectations for the performance of Electrolux at the beginning of 2010. Despite noting strong income in the fourth quarter of 2009, the share price dropped on presentation of the year-end report. The share subsequently recovered and outperformed the Affärsvärlden General Index during the first half of 2010.
The income reported by Electrolux in the third quarter of 2010 was relatively strong and the Group also reconfirmed it could reach its goal of an operating margin of 6%, excluding items affecting comparability. However, the Electrolux share displayed slightly weaker development than the Affärsvärlden General Index, primarily due to market concerns surrounding sales prices and the cost of raw materials. The share price recovered towards the end of the year and reached its all-time high, partly due to the strong upswing in the Swedish stock market.
Total return of Electrolux B-shares and trading volume on Nasdaq OMX Stockholm, 2006–2010
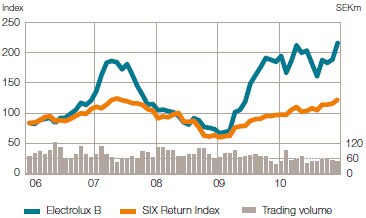
Yield
The opening price for the Electrolux B-share in 2010 was SEK 167.50. The highest closing price was SEK 194.70 on December 29. The lowest closing price was SEK 142.50 on August 31. The closing price for the B-share at year-end 2010 was SEK 191.00, which was 14% higher than at year-end 2009. Total return during the year was 17%. The market capitalization of Electrolux at year-end 2010 was approximately SEK 60 billion (48), which corresponded to 1.4% (1.4) of the total value of Nasdaq OMX Stockholm.
Over the past ten years, the average total return on an investment in Electrolux shares was 25.5%. The corresponding figure for SIX Return Index was 10.6%.
Share volatility
Over the past three years, the Electrolux share has shown a volatility of 48% (daily values), compared with an average volatility of 31% for a large cap company on Nasdaq OMX Stockholm. The beta value of the Electrolux share over the past five years is 1.25*. A beta value of more than 1 indicates that the share’s sensitivity to market fluctuations is above average.
*) Compared with OMX Stockholm All-Share (OMXSPI).
Conversion of shares
In accordance with the Articles of Association of Electrolux, owners of A-shares have the right to have such shares converted to B-shares. Conversion reduces the total number of votes in the company. In January 2010, at the request of shareholders, 439,150 A-shares were converted to B-shares.
Trading volume
The Electrolux share is listed on Nasdaq OMX Stockholm. Due to the deregulation of international capital markets and the increased foreign ownership of shares on Nasdaq OMX Stockholm, the listing on the London Stock Exchange (LSE) was no longer deemed necessary. After being listed on the LSE since 1928, the Electrolux B-share was delisted from the LSE on March 11.
There has recently been a clear trend towards new trading venues for shares. During 2010, 41% of Electrolux B-shares were traded outside Nasdaq OMX Stockholm, compared with 28% during 2009. In 2010, the Electrolux share accounted for 3.0% (2.7) of the shares traded on Nasdaq OMX Stockholm, of a total trading volume of
SEK 3,627 billion (3,393).
DJSI World Index
The Group’s sustainability performance and strategy helps attract and strengthen relations with investors. In 2010 and for the fourth consecutive year, Electrolux was recognized as leader in the consumer durables industry sector in the prestigious Dow Jones Sustainability Index (DJSI). Electrolux thereby ranks among the top 10% of the world’s 2,500 largest companies for social and environmental performance.