Quarterly information
Net sales and income per quarter
| SEKm | Q1 2012 |
Q2 2012 |
Q3 2012 |
Q4 2012 |
Full year 2012 |
Q1 2013 |
Q2 2013 |
Q3 2013 |
Q4 2013 |
Full year 2013 |
|---|---|---|---|---|---|---|---|---|---|---|
| Net sales | 25,875 | 27,763 | 27,171 | 29,185 | 109,994 | 25,328 | 27,674 | 27,258 | 28,891 | 109,151 |
| Operating income | 907 | 1,112 | 1,423 | 558 | 4,000 | 638 | 1,037 | 1,075 | -1,170 | 1,580 |
| Margin, % | 3.5 | 4.0 | 5.2 | 1.9 | 3.6 | 2.5 | 3.7 | 3.9 | -4.0 | 1.4 |
| Operating income, excluding items affecting comparability |
907 | 1,112 | 1,423 | 1,590 | 5,032 | 720 | 1,037 | 1,075 | 1,223 | 4,055 |
| Margin, % | 3.5 | 4.0 | 5.2 | 5.4 | 4.6 | 2.8 | 3.7 | 3.9 | 4.2 | 3.7 |
| Income after financial items | 712 | 910 | 1,170 | 362 | 3,154 | 483 | 859 | 884 | -1,322 | 904 |
| Income after financial items, excluding items affecting comparability | 712 | 910 | 1,170 | 1,394 | 4,186 | 565 | 859 | 884 | 1,071 | 3,379 |
| Income for the period | 499 | 701 | 923 | 242 | 2,365 | 361 | 642 | 656 | -987 | 672 |
| Earnings per share, SEK1) | 1.76 | 2.44 | 3.22 | 0.84 | 8.26 | 1.26 | 2.24 | 2.29 | -3.44 | 2.35 |
| Earnings per share, SEK, excluding items affecting comparability1) | 1.76 | 2.44 | 3.22 | 3.94 | 11.36 | 1.48 | 2.24 | 2.29 | 3.80 | 9.81 |
| Items affecting comparability2) | — | — | — | -1,032 | -1,032 | -82 | — | — | -2,393 | -2,475 |
| Number of shares after buy-backs, million | 286.1 | 286.1 | 286.1 | 286.1 | 286.1 | 286.2 | 286.2 | 286.2 | 286.2 | 286.2 |
| Average number of shares after buy-backs, million | 285.4 | 286.1 | 286.1 | 286.1 | 285.9 | 286.2 | 286.2 | 286.2 | 286.2 | 286.2 |
Net sales and income by business area per quarter
| SEKm | Q1 2012 |
Q2 2012 |
Q3 2012 |
Q4 2012 |
Full year 2012 |
Q1 2013 |
Q2 2013 |
Q3 2013 |
Q4 2013 |
Full year 2013 |
|---|---|---|---|---|---|---|---|---|---|---|
| Major Appliances Europe, Middle East and Africa |
|
|
|
|
|
|
|
|
|
|
| Net sales | 8,265 | 8,216 | 8,581 | 9,216 | 34,278 | 7,595 | 8,040 | 8,520 | 9,281 | 33,436 |
| Operating income | 271 | 205 | 294 | 335 | 1,105 | 11 | -2 | 111 | 227 | 347 |
| Margin, % | 3.3 | 2.5 | 3.4 | 3.6 | 3.2 | 0.1 | 0.0 | 1.3 | 2.4 | 1.0 |
| Major Appliances North America |
|
|
|
|
|
|
|
|
|
|
| Net sales | 7,107 | 8,599 | 7,771 | 7,207 | 30,684 | 7,678 | 8,448 | 8,165 | 7,573 | 31,864 |
| Operating income | 131 | 488 | 496 | 337 | 1,452 | 457 | 663 | 563 | 453 | 2,136 |
| Margin, % | 1.8 | 5.7 | 6.4 | 4.7 | 4.7 | 6.0 | 7.8 | 6.9 | 6.0 | 6.7 |
| Major Appliances Latin America |
|
|
|
|
|
|
|
|
|
|
| Net sales | 5,149 | 5,183 | 5,301 | 6,411 | 22,044 | 4,885 | 5,472 | 4,699 | 5,639 | 20,695 |
| Operating income | 278 | 316 | 339 | 657 | 1,590 | 251 | 261 | 243 | 224 | 979 |
| Margin, % | 5.4 | 6.1 | 6.4 | 10.2 | 7.2 | 5.1 | 4.8 | 5.2 | 4.0 | 4.7 |
| Major Appliances Asia/Pacific |
|
|
|
|
|
|
|
|
|
|
| Net sales | 1,841 | 2,198 | 2,107 | 2,259 | 8,405 | 1,948 | 2,227 | 2,321 | 2,157 | 8,653 |
| Operating income | 155 | 172 | 208 | 211 | 746 | 106 | 148 | 117 | 96 | 467 |
| Margin, % | 8.4 | 7.8 | 9.9 | 9.3 | 8.9 | 5.4 | 6.6 | 5.0 | 4.5 | 5.4 |
| Small Appliances |
|
|
|
|
|
|
|
|
|
|
| Net sales | 2,105 | 2,105 | 2,112 | 2,689 | 9,011 | 2,020 | 2,104 | 2,131 | 2,697 | 8,952 |
| Operating income | 93 | 25 | 124 | 219 | 461 | 17 | 50 | 97 | 227 | 391 |
| Margin, % | 4.4 | 1.2 | 5.9 | 8.1 | 5.1 | 0.8 | 2.4 | 4.6 | 8.4 | 4.4 |
| Professional Products |
|
|
|
|
|
|
|
|
|
|
| Net sales | 1,408 | 1,462 | 1,299 | 1,402 | 5,571 | 1,201 | 1,383 | 1,422 | 1,544 | 5,550 |
| Operating income | 130 | 154 | 149 | 155 | 588 | 59 | 112 | 167 | 172 | 510 |
| Margin, % | 9.2 | 10.5 | 11.5 | 11.1 | 10.6 | 4.9 | 8.1 | 11.7 | 11.1 | 9.2 |
| Other |
|
|
|
|
|
|
|
|
|
|
| Net sales | — | — | — | 1 | 1 | 1 | — | — | — | 1 |
| Operating income, common group costs, etc. | -151 | -248 | -187 | -324 | -910 | -181 | -195 | -223 | -176 | -775 |
| Total Group, excluding items affecting comparability |
|
|
|
|
|
|
|
|
|
|
| Net sales | 25,875 | 27,763 | 27,171 | 29,185 | 109,994 | 25,328 | 27,674 | 27,258 | 28,891 | 109,151 |
| Operating income | 907 | 1,112 | 1,423 | 1,590 | 5,032 | 720 | 1,037 | 1,075 | 1,223 | 4,055 |
| Margin, % | 3.5 | 4.0 | 5.2 | 5.4 | 4.6 | 2.8 | 3.7 | 3.9 | 4.2 | 3.7 |
| Items affecting comparability | — | — | — | -1,032 | -1,032 | -82 | — | — | -2,393 | -2,475 |
| Total Group |
|
|
|
|
|
|
|
|
|
|
| Net sales | 25,875 | 27,763 | 27,171 | 29,185 | 109,994 | 25,328 | 27,674 | 27,258 | 28,891 | 109,151 |
| Operating income | 907 | 1,112 | 1,423 | 558 | 4,000 | 638 | 1,037 | 1,075 | -1,170 | 1,580 |
| Margin, % | 3.5 | 4.0 | 5.2 | 1.9 | 3.6 | 2.5 | 3.7 | 3.9 | -4.0 | 1.4 |
CEO Statement

In 2013 we continued to deliver above our growth target and delivered 4.5% in organic sales growth.
CEO Statement
I'm convinced that raising product efficiency for the growing middle class is where long-term shareholder value creation lies.
Our products
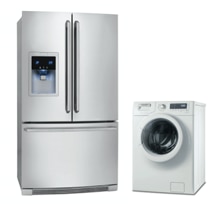
Electrolux is the only appliance manufacturer in the industry to offer complete solutions for both consumers and professionals. The focus is on innovative and energy-efficient products in the premium segments.
Sustainability
Achieving the Group's vision of sustainability leadership is crucial to realizing the business strategy. The objective is to develop smarter, more accessible, resource-efficient solutions that meet people's needs and improve their lives. Read the comprehensive sustainability performance review.
Awards & recognition
Financial Reporting
Net sales for the Electrolux Group in 2013 amounted to SEK 109,151m, as against SEK 109,994m in the previous year. The organic sales growth was 4.5%, while currencies had an impact of -5.3%.
