The Electrolux share
In 2013, expectations were yet again high despite challenging market conditions and increased headwinds from currency fluctuations. The Group, however, continued to deliver organic growth above its target during the year and operating income was at a solid level. Total return for the Electrolux share was 3 percent in 2013.

2013 characterized a year with stable development for the Electrolux share which showed a slight decline of –1%, while the broader Swedish market index, Affärsvärlden General Index, increased by 21% over the same period. The relative underperformance was mainly linked to weak market demand in Europe and consecutive quarters of unexpected currency headwinds which affected underlying earnings negatively. However, the Group met market expectations in terms of continued growth, healthy underlying profitability and solid cash-flow generation.
After a weak start of the year, Electrolux posted a strong organic growth of 5.9% in the second quarter of 2013 and gained market share. In the third quarter, the Group continued to show good growth and delivered an operating margin of close to 4% as a result of improved price and mix.
Data per share
|
|
2004 | 2005 | 20069) | 20079) | 2008 | 2009 | 2010 | 2011 | 2012 | 2013 |
|---|---|---|---|---|---|---|---|---|---|---|
| Year-end trading price, B shares, SEK1) |
65.90 | 89.50 | 116.90 | 108.50 | 66.75 | 167.50 | 191.00 | 109.70 | 170.50 | 168.50 |
| Year-end trading price, B shares, SEK |
152.00 | 206.50 | 137.00 | 108.50 | 66.75 | 167.50 | 191.00 | 109.70 | 170.50 | 168.50 |
| Highest trading price, B shares, SEK |
174.50 | 90.50 | 119.00 | 190.00 | 106.00 | 184.10 | 194.70 | 195.60 | 179.00 | 192.70 |
| Lowest trading price, B shares, SEK |
125.50 | 62.00 | 78.50 | 102.00 | 53.50 | 57.50 | 142.50 | 95.30 | 111.50 | 153.70 |
| Change in price during the year,% |
–4 | 36 | 319) | –7 | –38 | 151 | 14 | –43 | 55 | –1 |
| Equity per share, SEK |
81 | 88 | 47 | 57 | 58 | 66 | 72 | 73 | 55 | 50 |
| Trading price/equity, % | 187 | 234 | 2471) | 191 | 116 | 253 | 264 | 151 | 310 | 338 |
| Dividend, SEK | 7.00 | 7.50 | 4.00 | 4.25 | 0 | 4.00 | 6.50 | 6.50 | 6.50 | 6.502) |
| Dividend as % of net income3) 4) |
46 | 47 | 37 | 36 | 0 | 29 | 39 | 86 | 57 | 66 |
| Dividend yield, %5) | 4.6 | 3.6 | 3.41) | 3.9 | 0 | 2.4 | 3.4 | 5.9 | 3.8 | 3.9 |
| Earnings per share, SEK |
10.92 | 6.05 | 9.17 | 10.41 | 1.29 | 9.18 | 14.04 | 7.25 | 8.26 | 2.35 |
| Earnings per share, SEK4) |
15.24 | 15.82 | 10.89 | 11.66 | 2.32 | 13.56 | 16.65 | 7.55 | 11.36 | 9.81 |
| Cash flow, SEK6) | 10.81 | 2.45 | 7.53 | 4.54 | 4.22 | 29.16 | 26.98 | 18.97 | 24.74 | 15.57 |
| EBIT multiple7) | 9.5 | 16.1 | 8.01) | 7.9 | 19.8 | 12.8 | 10.8 | 13.4 | 14.6 | 38.8 |
| EBIT multiple4) 7) | 6.7 | 9.1 | 7.11) | 7.3 | 15.2 | 9.1 | 9.1 | 12.8 | 11.6 | 15.1 |
| P/E ratio8) | 13.9 | 34.1 | 12.71) | 10.4 | 51.7 | 18.2 | 13.6 | 15.1 | 20.6 | 71.7 |
| P/E ratio4) 8) | 10.0 | 13.1 | 10.71) | 9.3 | 28.8 | 12.4 | 11.5 | 14.5 | 15.0 | 17.2 |
| Number of shareholders |
63,800 | 60,900 | 59,500 | 52,700 | 52,600 | 52,000 | 57,200 | 58,800 | 51,800 | 51,500 |
CEO Statement

In 2013 we continued to deliver above our growth target and delivered 4.5% in organic sales growth.
CEO Statement

I'm convinced that raising product efficiency for the growing middle class is where long-term shareholder value creation lies.
Our products

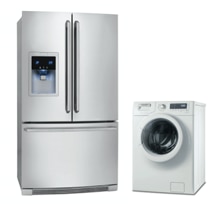
Electrolux is the only appliance manufacturer in the industry to offer complete solutions for both consumers and professionals. The focus is on innovative and energy-efficient products in the premium segments.
Sustainability
Achieving the Group's vision of sustainability leadership is crucial to realizing the business strategy. The objective is to develop smarter, more accessible, resource-efficient solutions that meet people's needs and improve their lives. Read the comprehensive sustainability performance review.
Awards & recognition

Financial Reporting
Net sales for the Electrolux Group in 2013 amounted to SEK 109,151m, as against SEK 109,994m in the previous year. The organic sales growth was 4.5%, while currencies had an impact of -5.3%.
