2013 Summary
- Organic sales growth of 4.5%.
- Strong performance for Major Appliances North America.
- Weak market conditions in Europe and unfavourable currency movements impacted earnings.
- A year of extensive product launches in several markets and product mix improvements.
- The Board proposes an unchanged dividend of SEK 6.50 per share.
Business areas
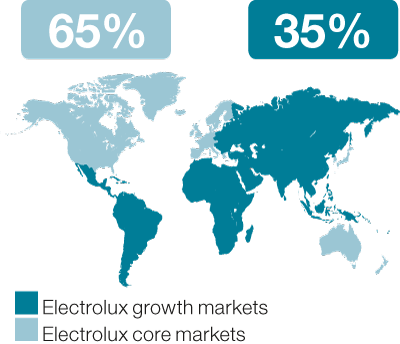
The Group’s products are sold in more than 150 markets. The largest of these are in Europe and North America. Electrolux is expanding its presence in growth markets, such as Latin America, Africa, the Middle East and Asia.
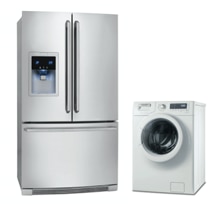
Our products
Electrolux is the only appliance manufacturer in the industry to offer complete solutions for both consumers and professionals. The focus is on innovative and energy-efficient products in the premium segments.
Strong organic sales growth
Net sales
+4.5%
Sales growth in most regions except for Europe. Growth was particularly strong in North America, Asia/Pacific and Latin America. Product launches and price increases contributed to the positive sales trend.
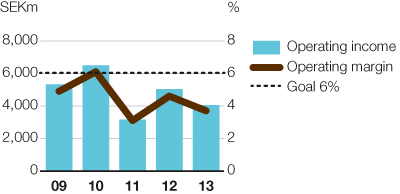
Operating margin
3.7%
Operating income, excluding items affecting comparability, amounted to SEK 4,055m corresponding to a margin of 3.7%. Increased sales in most regions and product-mix improvements positively contributed to operating income, while continued weak markets in Europe and unfavourable currency development had a negative impact. 2013 was a year with extensive product launches across most markets. The significance of sales in growth markets is increasing. Electrolux aims to increase this share to 50% of sales.
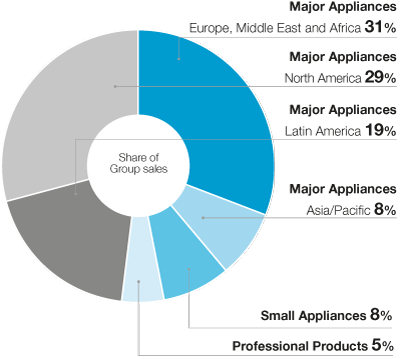
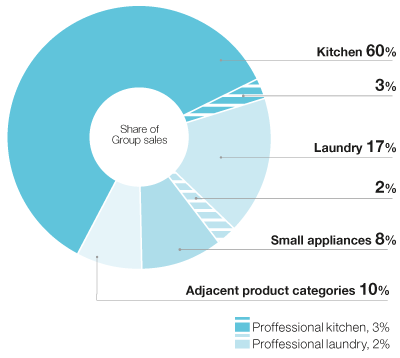
Share of Group sales
Performance in relation to Electrolux financial goals
The financial goals set by Electrolux aim to strengthen the Group’s leading, global position in the industry and assist in generating a healthy total return for Electrolux shareholders.
| Financial goals over a business cycle* | Five-year |
|---|---|
|
Operating margin 6% of at least 6% |
|
|
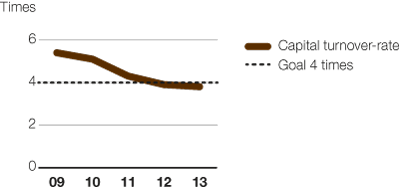
Capital turnover-rate 4times of at least 4 times |
|
|
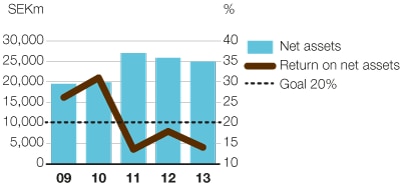
Return on net assets 20% of at least 20% |
|
|
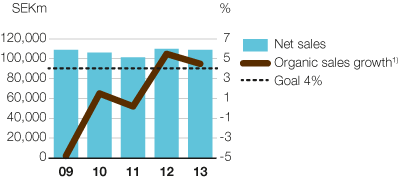
Average growth 4% of at least 4% annually |
|
CEO Statement
In 2013 we continued to deliver above our growth target and delivered 4.5% in organic sales growth.
CEO Statement
I'm convinced that raising product efficiency for the growing middle class is where long-term shareholder value creation lies.
Our products
Electrolux is the only appliance manufacturer in the industry to offer complete solutions for both consumers and professionals. The focus is on innovative and energy-efficient products in the premium segments.
Sustainability
Achieving the Group's vision of sustainability leadership is crucial to realizing the business strategy. The objective is to develop smarter, more accessible, resource-efficient solutions that meet people's needs and improve their lives. Read the comprehensive sustainability performance review.
Awards & recognition
Financial Reporting
Net sales for the Electrolux Group in 2013 amounted to SEK 109,151m, as against SEK 109,994m in the previous year. The organic sales growth was 4.5%, while currencies had an impact of -5.3%.
