Consolidated balance sheet
| SEKm | Note | January 1, 20121) | December 31, 20121) | December 31, 2013 |
|---|---|---|---|---|
| ASSETS |
|
|
|
|
| Non-current assets |
|
|
|
|
| Property, plant and equipment | 12 | 15,613 | 16,693 | 17,264 |
| Goodwill | 13 | 6,008 | 5,541 | 4,875 |
| Other intangible assets | 13 | 5,146 | 5,079 | 4,011 |
| Investments in associates | 29 | 18 | 16 | 221 |
| Deferred tax assets | 10 | 3,669 | 4,156 | 4,385 |
| Financial assets | 18 | 306 | 333 | 279 |
| Pension plan assets | 22 | 371 | 286 | 445 |
| Other non-current assets | 14 | 1,212 | 481 | 752 |
| Total non-current assets |
|
32,343 | 32,585 | 32,232 |
| Current assets |
|
|
|
|
| Inventories | 15 | 11,957 | 12,963 | 12,154 |
| Trade receivables | 17, 18 | 19,226 | 18,288 | 19,441 |
| Tax assets |
|
666 | 609 | 746 |
| Derivatives | 18 | 252 | 184 | 268 |
| Other current assets | 16 | 3,662 | 3,607 | 4,405 |
| Short-term investments | 18 | 337 | 123 | 148 |
| Cash and cash equivalents | 18 | 6,966 | 6,835 | 6,607 |
| Total current assets |
|
43,066 | 42,609 | 43,769 |
| Total assets |
|
75,409 | 75,194 | 76,001 |
| EQUITY AND LIABILITIES |
|
|
|
|
| Equity attributable to equity holders of the Parent Company |
|
|
|
|
| Share capital | 20 | 1,545 | 1,545 | 1,545 |
| Other paid-in capital | 20 | 2,905 | 2,905 | 2,905 |
| Other reserves | 20 | 324 | -1,146 | -2,658 |
| Retained earnings | 20 | 12,763 | 12,381 | 12,482 |
|
|
|
17,537 | 15,685 | 14,274 |
| Non-controlling interests |
|
109 | 41 | 34 |
| Total equity |
|
17,646 | 15,726 | 14,308 |
| Non-current liabilities |
|
|
|
|
| Long-term borrowings | 18 | 9,639 | 10,005 | 11,935 |
| Deferred tax liabilities | 10 | 1,076 | 1,117 | 1,026 |
| Provisions for post-employment benefits | 22 | 3,992 | 4,765 | 3,425 |
| Other provisions | 23 | 5,300 | 4,551 | 4,522 |
| Total non-current liabilities |
|
20,007 | 20,438 | 20,908 |
| Current liabilities |
|
|
|
|
| Accounts payable | 18 | 18,490 | 20,590 | 20,607 |
| Tax liabilities |
|
1,717 | 1,287 | 1,331 |
| Other liabilities | 24 | 10,690 | 11,971 | 12,886 |
| Short-term borrowings | 18 | 4,170 | 2,795 | 2,733 |
| Derivatives | 18 | 324 | 241 | 194 |
| Other provisions | 23 | 2,365 | 2,146 | 3,034 |
| Total current liabilities |
|
37,756 | 39,030 | 40,785 |
| Total liabilities |
|
57,763 | 59,468 | 61,693 |
| Total equity and liabilities |
|
75,409 | 75,194 | 76,001 |
| Pledged assets | 19 | 94 | 78 | 69 |
| Contingent liabilities | 25 | 1,276 | 1,610 | 1,458 |
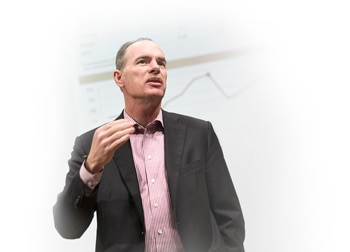
CEO Statement
In 2013 we continued to deliver above our growth target and delivered 4.5% in organic sales growth.
CEO Statement
I'm convinced that raising product efficiency for the growing middle class is where long-term shareholder value creation lies.
Our products
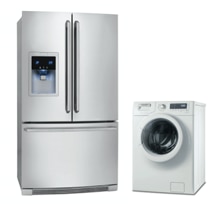
Electrolux is the only appliance manufacturer in the industry to offer complete solutions for both consumers and professionals. The focus is on innovative and energy-efficient products in the premium segments.
Sustainability
Achieving the Group's vision of sustainability leadership is crucial to realizing the business strategy. The objective is to develop smarter, more accessible, resource-efficient solutions that meet people's needs and improve their lives. Read the comprehensive sustainability performance review.
Awards & recognition
Financial Reporting
Net sales for the Electrolux Group in 2013 amounted to SEK 109,151m, as against SEK 109,994m in the previous year. The organic sales growth was 4.5%, while currencies had an impact of -5.3%.
