| 2007 | 2008 | 2009 | 2010 | 2011 | 2012 | 2013 | 2014 | 2015 | 2016 | |
|---|---|---|---|---|---|---|---|---|---|---|
| Year-end trading price, B shares, SEK | 108.50 | 66.75 | 167.50 | 191.00 | 109.70 | 170.50 | 168.50 | 228.80 | 205.20 | 226.30 |
| Highest trading price, B shares, SEK | 190.00 | 106.00 | 184.10 | 194.70 | 195.60 | 179.00 | 192.70 | 231.10 | 282.80 | 239.60 |
| Lowest trading price, B shares, SEK | 102.00 | 53.50 | 57.50 | 142.50 | 95.30 | 111.50 | 153.70 | 135.30 | 193.10 | 173.10 |
| Change in price during the year, % | –7 | –38 | 151 | 14 | –43 | 55 | –1 | 36 | –10 | 10 |
| Equity per share, SEK | 57 | 58 | 66 | 72 | 73 | 55 | 50 | 58 | 52 | 62 |
| Trading price/equity, % | 191 | 116 | 253 | 264 | 151 | 310 | 338 | 398 | 393 | 367 |
| Dividend, SEK | 4.25 | 0 | 4.00 | 6.50 | 6.50 | 6.50 | 6.50 | 6.50 | 6.50 | 7.501) |
| Dividend as % of net income2) 3) | 36 | 0 | 29 | 39 | 86 | 57 | 66 | 58 | 49 | 48 |
| Dividend yield, %4) | 3.9 | 0 | 2.4 | 3.4 | 5.9 | 3.8 | 3.9 | 2.8 | 3.2 | 3.3 |
| Earnings per share, SEK | 10.41 | 1.29 | 9.18 | 14.04 | 7.25 | 8.26 | 2.35 | 7.83 | 5.45 | 15.64 |
| Earnings per share, SEK3) | 11.66 | 2.32 | 13.56 | 16.65 | 7.55 | 11.36 | 9.81 | 11.30 | 5.45 | 15.64 |
| Cash flow, SEK5) | 4.54 | 4.22 | 29.16 | 26.98 | 18.97 | 24.74 | 15.57 | 27.35 | 28.76 | 35.37 |
| EBIT multiple6) | 7.9 | 19.8 | 12.8 | 10.8 | 13.4 | 14.6 | 38.8 | 22.4 | 25.5 | 11.2 |
| EBIT multiple3) 6) | 7.3 | 15.2 | 9.1 | 9.1 | 12.8 | 11.6 | 15.1 | 16.8 | 25.5 | 11.2 |
| P/E ratio7) | 10.4 | 51.7 | 18.2 | 13.6 | 15.1 | 20.6 | 71.7 | 29.2 | 37.7 | 14.5 |
| P/E ratio3) 7) | 9.3 | 28.8 | 12.4 | 11.5 | 14.5 | 15.0 | 17.2 | 20.2 | 37.7 | 14.5 |
| Number of shareholders | 52,700 | 52,600 | 52,000 | 57,200 | 58,800 | 51,800 | 51,500 | 46,500 | 45,500 | 48,900 |
1) Proposed by the Board.
2) Dividend as percentage of income for the period.
3) Excluding items affecting comparability until 2014. As of 2015, the accounting practice of items affecting comparability for restructuring charges is no longer used.
4) Dividend per share divided by trading price at year-end.
5) Cash flow from operations less capital expenditure, divided by the average number of shares after buy-backs.
6) Market capitalization excluding buy-backs, plus net borrowings and non-controlling interests, divided by operating income.
7) Trading price in relation to earnings per share.
Good set of results with stable growth and improved underlying profit. Updated market outlook for North America.
Electrolux holds its CMD in Stockholm and the key messages are consumer focus and operational improvement.
Strong Q1 driven by margin improvement across most business areas and improved efficiency gains.
Cost execution on track and improving profitability. Strong cash flow generation.
Continued progress in operational improvement with higher margins but slower market growth.
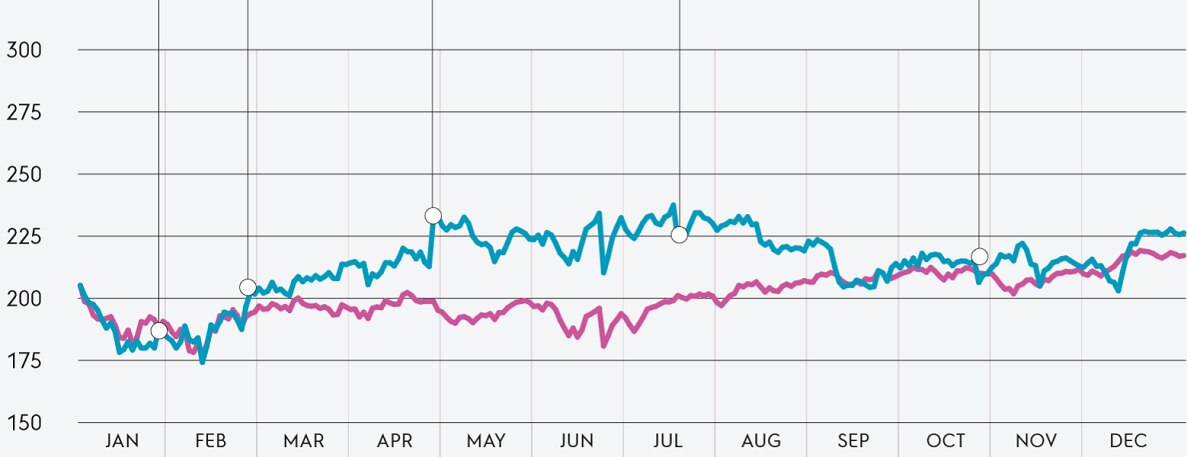
Comments from analysts Electrolux B share OMX Stockholm Index
Jan
Feb
Mar
Apr
May
Jun
Jul
Aug
Sep
Oct
Nov
Dec
• Earnings improvement across most
business areas
• Dividend of SEK 6.50 per share
• Continued focus on product portfolio management
• Announced acquisition of water heater company Kwikot in South Africa
• Electrolux presents the “For the Better Initiative”
• New laundry collection launched in the North American market
• Electrolux showcase new AEG brand at IFA 2016 in Berlin
• Divestment of Eureka brand in North America
• Cooking plant in Memphis stabilized
• Launch of the connected oven with camera
• Acquisition of vintec in Australia
• New premium Frigidaire dish models introduced in North America
• Reinforced cost actions
in Latin America
• Good demand growth in North America
• Tailwind from commodity prices
• Continued volatility in the currency markets
• Challenging macro
situation in Latin America
• Competitive market pressure in the US
• Strong Black Friday sales
• Positive demand in
Western Europe
• Strengthening of the Brazilian Real
• Demand in UK
weakening post Brexit
• Markets in Russia and Ukraine stabilizing
• Brazil continues to weaken
| After Q4 2015 |
After Q1 2016 |
After Q2 2016 |
After Q3 2016 |
After Q4 2016 |
|
|---|---|---|---|---|---|
| Buy | 38% | 53% | 50% | 59% | 59% |
| Hold | 38% | 47% | 44% | 35% | 23% |
| Sell | 24% | 0% | 6% | 6% | 18% |
The Electrolux share is listed on Nasdaq Stockholm. The market capitalization of Electrolux at year-end 2016 was approximately SEK 70bn (63), which corresponded to 1.8% (1.5) of the total turnover value of Nasdaq Stockholm. The company’s outstanding shares are divided into A shares and B shares. A shares entitle the holder to one vote while B shares entitle the holder to one-tenth of a vote.
The Board of Directors proposes a dividend for 2016 of SEK 7.50 per share, equivalent to a total dividend payment of approximately SEK 2,155m. The proposed dividend corresponds to approximately 48% of income for the period. The dividend is proposed to be paid in two equal installments. Based on the share price of Electrolux B shares at the end of 2016, the dividend yield for 2016 was 3.3%.
The Group’s goal is for the dividend to correspond to at least 30% of income for the period. For a number of years, the dividend level has been considerably higher than 30%.
The majority of the total share capital as of December 31, 2016, was owned by Swedish institutions, mutual funds and private investors amounting to 54%. During the year, the proportion of the capital held by foreign owners decreased and amounted to approximately 46% at the end of the year. Foreign investors are not always recorded in the share register as foreign banks and other custodians may be registered for one or several customers’ shares, which is why the actual owners are then not usually displayed in the register.
Electrolux maintains a number of long-term incentive programs for senior management. Since 2004, the Group has three-year performance-based share programs.
At year-end 2016, the incentive programs had a minor impact on the dilution of the total number of shares.
In accordance with the Articles of Association of AB Electrolux, owners of A shares have the right to have such shares converted to B shares. Conversion reduces the total number of votes in the company. In 2016, no Class A shares were converted to Class B shares. The total number of registered shares in the company amounts to 308,920,308 shares, of which 8,192,539 are A shares and 300,727,769 are B shares.
| Share capital, % | Voting rights, % | |
|---|---|---|
| Investor AB | 15.5 | 29.9 |
| JP Morgan Asset Management | 4.9 | 3.9 |
| BlackRock, Inc. | 4.00 | 3.2 |
| Alecta Pension Insurance | 3.1 | 3.7 |
| Swedbank Robur Funds | 3.0 | 2.5 |
| Norges Bank Investment Management | 2.6 | 2.1 |
| Nordea Investment Management | 2.3 | 1.8 |
| AMF Insurance & Funds | 1.7 | 1.4 |
| Fiduciary Management Funds | 1.7 | 1.4 |
| Unionen | 1.0 | 0.8 |
| Stichting Pensioenfonds ABP | 0.9 | 0.7 |
| Other shareholders | 52.3 | 48.6 |
| External shareholders | 93.0 | 100.0 |
| AB Electrolux | 7.0 | 0.0 |
| Total | 100.0 | 100.0 |
Source: Euroclear Sweden and Holding as of December 31, 2016. The figures are rounded off. Information regarding ownership structure is updated quarterly on www.electroluxgroup.com
| 2016 | 2015 | |
|---|---|---|
| Number of traded shares, million | 292.3 | 383.4 |
| Value of traded shares, SEKbn | 61.6 | 93.5 |
| Average daily trading volume, million | 1.2 | 1.5 |
| Average daily trading volume (value), SEKm | 244 | 373 |
| Number of issued/cancelled ADRs | 1,822.6 | 2,311.5 |
| Number of ADRs outstanding | 813.2 | 1,752.4 |
Source: Nasdaq Stockholm, Citi.
During 2016, 48% of Electrolux B shares were traded outside Nasdaq Stockholm, compared to 40% during 2015. In 2016, the Electrolux share accounted for 1.6% (2.2) of the shares traded on Nasdaq Stockholm, of a total trading turnover of SEK 3,850bn (4,253).
Share data |
|
|---|---|
| Share listing1) | Stockholm |
| Number of shares | 308,920,308 |
| of which A shares | 8,192,539 |
| of which B shares | 300,727,769 |
| Quota value | SEK 5 |
| Market capitalization at December 31, 2016 | SEK 70 billion |
| GICS code2) | 25201040 |
| Ticker codes | Reuters ELUXb.ST |
| Bloomberg ELUXB SS |
1) Trading in Electrolux ADRs was transferred from Nasdaq to the US Over-the-Counter market as of March 31, 2005. One ADR corresponds to two B shares.
2) MSCI’s Global Industry Classification Standard (used for securities).
| % | 2016 | 2015 |
|---|---|---|
| Nasdaq Stockholm | 51.6 | 60 |
| BATS CXE | 23.7 | 25 |
| BATS BXE | 10.4 | 6.2 |
| Turquoise | 14.3 | 8.8 |
| Total | 100.0 | 100.0 |
Source: Electrolux and Nasdaq.
| SEK thousand | 2012 | 2013 | 2014 | 2015 | 2016 |
|---|---|---|---|---|---|
| A shares | 93 | 127 | 146 | 269 | 178 |
| B shares | 310,501 | 280,457 | 311,398 | 372,570 | 243,520 |
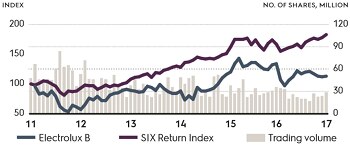
In 2016, an average of 1.2 million Electrolux shares were traded daily on Nasdaq Stockholm.
| Sweden, 54% | 54 |
| USA, 18% | 18 |
| UK, 12% | 12 |
| Luxembourg, 3% | 3 |
| Norway, 3% | 3 |
| Other, 10% | 10 |
As of December 31, 2016, approximately 46% of the total share capital was owned by foreign investors. Source: Euroclear Sweden and Holding as of December 31, 2016.
| 06 | 07 | 08 | 09 | 10 | 11 | 12 | 13 | 14 | 15 | 16 | |
| P/E ratio* | 10.7 | 9.3 | 28.8 | 12.4 | 11.5 | 14.5 | 15 | 17.2 | 20.2 | 15.4 | 14.5 |
| Dividend yield, % | 3.4 | 3.9 | 0 | 2.4 | 3.4 | 5.9 | 3.8 | 3.9 | 2.8 | 3.2 | 3.3 |
At year-end 2016, the P/E ratio for Electrolux B shares was 14.5. The dividend yield was 3.3% based on the Board’s proposal for a dividend of SEK 7.50 per share for 2016.
* Excluding items affecting comparability until 2014 and costs for GE in 2015.
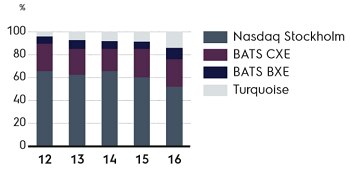
An increasing portion of Electrolux shares are traded on new trading platforms. Approximately 52% of total trading volume of Electrolux is handled through the Nasdaq Stockholm. BATS has significantly increased its share of total trades in recent years.
The Group’s sustainability performance strengthens relations with investors. In 2016, and for the tenth consecutive year, Electrolux was recognized as a leader in the household durables industry in the prestigious Dow Jones Sustainability Index (DJSI). Electrolux thereby ranks among the top 10% of the world’s 2,500 largest companies for social and environmental performance. Additionally, Electrolux has received recognition from other indexes and organizations, including RobecoSAM.
![]()
![]()